Dealing With Murphy's Law at upday.
11 minutes readIn this blog post we will provide a few insights on the architecture of the upday news app (both backend and frontend), focusing on the work that has been put on the resiliency and robustness of the components around the My News feature.
upday & Samsung
Before digging into the technicalities, it’s worth to spend a few words on what upday is and which responsabilities we have towards our stake holders.
The App
upday is a fruit of a collaboration between Axel Springer and Samsung. The end result is a news application for Android, pre-installed as the default news-app on most of the Samsung devices (S7, S8, A series etc).
The one purpose of the application is to deliver relevant news content to the users. The goal is achieved by means of the two news streams that the app provides:
- Top News: this section is an editorial curated news stream, whose titles and headlines are manually crafted by a team of editors (in each of the available countries). It’s supposed to provide the user with all the relevant news of the moment, independently from taste and preferences.
- My News: this is the “machine curated” news stream, generated by a swarm of super intelligent cyber beings enslaved to our will. Or at least that’s how business sometimes likes to sell it. The important thing is that this stream is personalized based on the user explicit feedback and settings and behaviour.
SLA With Samsung
Collaborations with big players come always at a cost. For the engineering team at upday this cost is the Service Level Agreement that we need to commit to. So, when a problem with the service occurs, it’s categorized in a specific severity level that also defines then the actions to take. These are, in Layman’s terms, the 4 severity levels of our SLA:
- Severity 4: An Error affecting non- upday ‘s Services with little or no Users impact. More concisely: no one cares. It’s hit once a single third-party picture wouldn’t load, for instance.
- Severity 3: Errors that causes degradation of the UX. Like when you receive a news about the next Justin Bieber concert although you explicitely stated that you like music.
- Severity 2: Partial unavailability of the services. Reached, among the other cases, when Top News stop being delivered in one country. Editorial laziness could be a cause.
- Severity 1: Full outage, across all features, across all countries. It’s the blue screen of death of upday.
Each severity layer requires different response times, from days (less severe) to minutes (most severe). That’s why at upday we try not to ever exceed Severity 3, for the sake of our sleep and nerves.
General Architecture For My News
Talking about our backend technology, we have always tried to structure our architecture in a Micro-Service oriented way. Sometimes we have services that are actually small and with contained use-cases, sometimes we build the Goldman Sachs of backends. The important thing is that each team has its own responsabilities and takes care of its own sh…tuff.
Therefore, each feature in the app has its own service or set of services, including Top New and My News. The outage of one does not imply the outage of the others.
Given that the focus of this article is the availability of My News (the most tricky maybe), we will start by giving a brief overview of the stream structure and the architecture involved in this feature.
My News Stream
The My News section in upday is a potentially endless scrollable list of full screen cards, each displaying the content of a news. A sample:

Using our terminology, a card is called a note and a whole stream of notes symphony. Each note has constraints about how to select an article for the symphony, so it basically defines a subset of all existing articles. A couple of examples: a note could be just about fresh main stream news, another note could identify all trending news.
Each note is built differently, some of them are even provided by specific micro-or-so-services. The whole My News stream is then, to some extent, very modular. Some notes are also not constrained by the user preferences (to provide a more serendipitous experience).
My News Components
Below a simplified version of the components involved in the delivery of My News
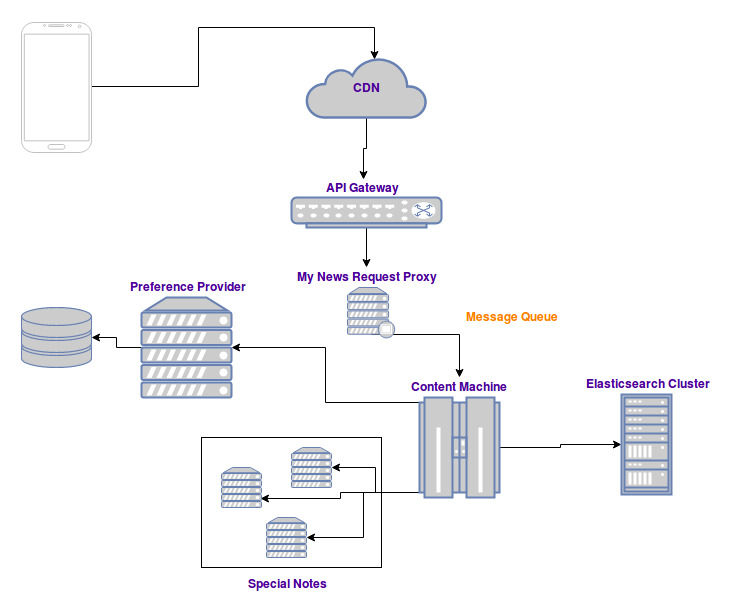
Quick overview of the responsabilities:
- CDN: edge cache
- API Gateway: performs authentication, SSL termination… and, most importantly, forwards each request to the right service. My News requests, specifically, are forwarded to the so-called My news Request Proxy
- My News Request Proxy: exposes the public APIs and deals with the app needs
- Content Machine: the core of the news stream creation. It leverages Elasticsearch to create some of the notes, Preference provider to retrieve user preferences and some other services to build specific special notes
- Preference Provider: it’s responsible of providing user defined preferences and other inferred features, helped by other data mining components (not shown for simplicity)
- Special Notes: notes that require specific technology to be created. For instance collaborative filtering.
- App: take a guess
Our infrastructure is immutable and each component is autoscaled, so we will not go into the details of what happens if a developer shuts down a single instance (answer: nothing).
The Problem
Each of these components could fail and will fail at some point. The challenge is to make sure that the user doesn’t notice or doesn’t get really annoyed.
Unleash The Chaos Monkey1
We will see now what the failover mechanism in place for each of the surprises that Murphy has prepared for us.
Special Notes
As mentioned already, special notes define article subsets that are computed using specific technology. Our collaborative filtering note is, for instance, generated leveraging Apache Mahout. It happens that these components slow down or break once in a while, given their computationally intensive tasks and dependencies.
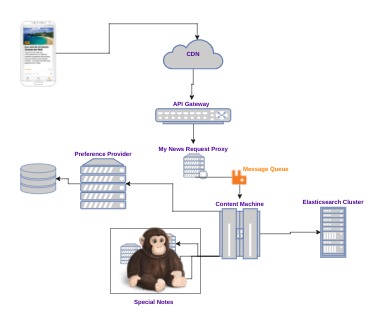
Mitigation:
- Circuit breakers: the content machine will give these components a maximum amount of time to return content. Once over, the note will simply be skipped. Given that thes notes are less than 10% of the whole symphony, the user will not notice any difference in the app, although it might not get highly converting content for a while.
Severity level: 4
Elasticsearch Cluster
Although it’s quite a tough challenge to take down an Elasticsearch cluster, we still managed quite a few times to do it. AWS once had networking issues, hence the whole cluster has been partitioned away from the Content Machine. This basically means that the Content Machine is isolated from our content storage.
Mitigation:
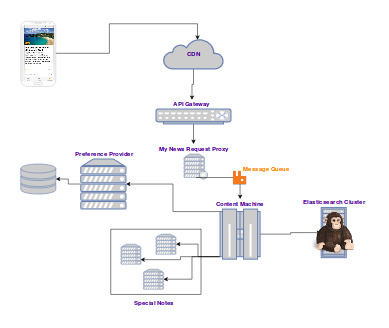
- In memory cache, layer 1: when content for a note is required, a bigger amount is fetched from Elasticsearch before continuing with the stream generation. From the whole pool of articles that matches the note criterias, only the needed ones are used. Essentially, other instances of the same notes are picked from the in memory pools.
- In memory cache, layer 2: a bunch of periodic background jobs are collecting (from Elasticsearch) content for preference independent notes. These notes are then generated purely out of memory when the user requests a stream.
- In memory cache, layer 3: a bunch of predefined symphonies is kept in memory as a final fallback, in case all the pools have been fully used or expired.
Severity level: 3-4 (for at least 30 minutes. Degradation might become more noticeable after a longer time)
Preference Provider
By being an “online synchronous component” (the load is proportional to the traffic), sudden traffic spikes and slow autoscaling can make temporarily shake temporarily, with slow downs and unavailabilities.
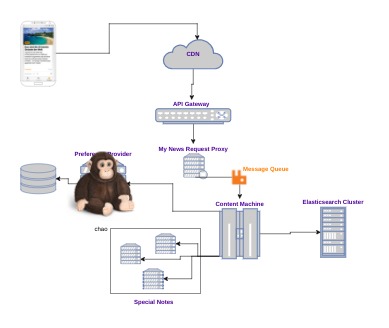
Mitigation:
- Circuit breaker and content degradation: the content machine will again open the circuit if the Preference Provider takes longer then a minimum amount of time to reply or becomes unavailable. In this case, a symphony with all preferences switched on is generated.
Severity level: 3
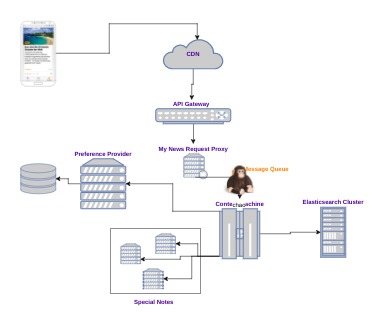
Rabbit MQ
The RabbitMQ cluster has been configured for high availability. Yet, it happened that a misconfiguration in the maximum open files on conjunction with a huge traffic slash, made the cluster partially go down and brain split during a wrong recovery (worst weekend ever for the the guys on call).
Mitigation:
- Switch to synchronous: The My New Request proxy, upon recognizing the unavailability of the message queue service, will start calling the synchronous APIs of the Content Machine. The solution always gave us enough time to address the issue.
Severity level: None (although the Content Machine might suffer under prolongued exposure to synchronous requests).
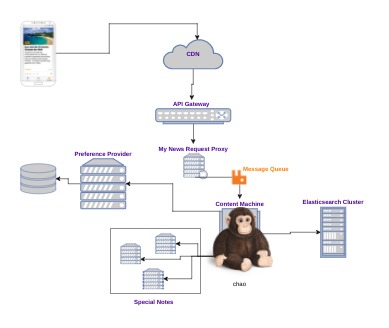
Content Machine
This component usually never fails, but when it fails, it fails epicly. It’s usually when the on call engineer start getting cold sweats.
Mitigation:
- Default news: the My News Request proxy keeps a cache of up-to-date default symphonies (fetched periodically from the content machine itself), that can be used during a prolongued outage of the content machine. These symphonies are not personalized.
Severity level: 3
Full Failure
Sometimes the more external components go down (API-Gateway, My News proxy) or maybe there are even prolongued failures of multiple internal services. In these cases, there is not much to do if not praying…
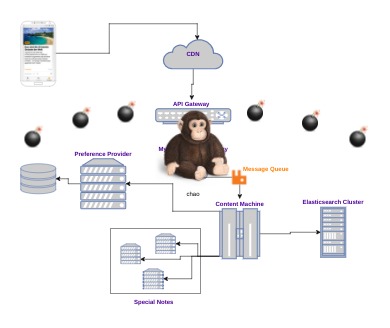
… it’s not true. It’s in these cases that the mother of all failovers kicks in. In order to give time to the ops to figure out the issue and fix it, the whole infrastructure is basically replaced. How? The solution below:
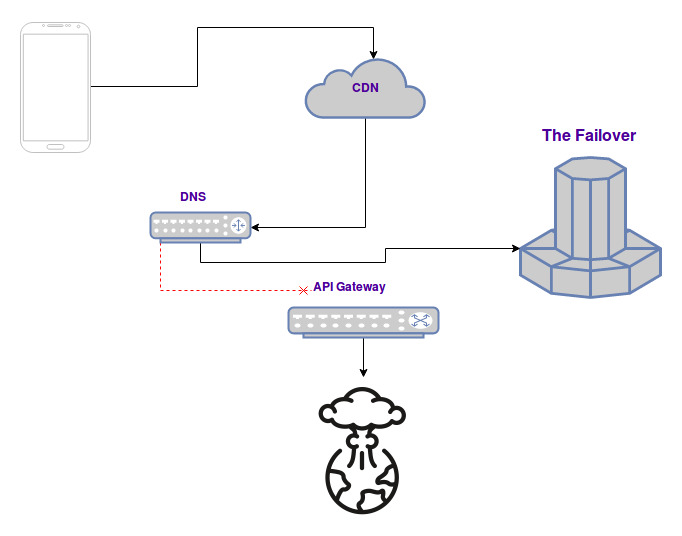
The A record of the DNS pointing to the origin (namely the API Gateway) is replaced with the IP of The Failover.
This component has been built keeping the complexity as low as possible and loaded with monitors and alarms. Its only purpose is to fetch a bunch of symphonies periodically to be delivered as they are upon request. This usually gives us around 30 minutes to react and try to fix the issue, before most of the users start calling customer support.
Severity level: 3 (for around 30 minutes)
So far we never went beyond Severity level 3.
Conclusion
This is just an overview of how we partly manage our backend availability at upday. These are not the only measures that we use: many monitors and alerts (with Datadog btw) have been deployed, some of them give us early clues of potential future problems (for instance low heap space on some instances, load going above average…). This gives us the chance to address issues before they explode into minor or major outages.
On top of this, it’s worth mentioning the comprehensive amount of unit, integration and system tests that must be developed before any change can be deployed to production. Trust me: there would be a few outages per week if this would not be done. We are not in a condition where we can “simply hot fix production”.
This is also just the current stage of our system: as we started, we had almost nothing of this in place and failure by failure we became more aware of how careful one has to be when dealing with big stakeholders and micro services (pun intended). Now we can kind of sleep well… usually.
PS: bring it on, Murphy.
1: We didn’t actually use Netflix Chaos Monkey, but we developed a home-made solution by following their example.