Product Management Then & Now(or, why user feedback sucks)
16 minutes read“Until now, sociologists have depended on limited data sets and surveys that tell us how people say they think and behave, rather than what they actually do.”
- (Pentland, 2015)
I grew up thinking I was clever. My grades seemed to say so, and my parents certainly did. But I wasn’t sure exactly what that meant, and at some point I settled on the conclusion that being clever means you probably don’t need to check your math. If only I’d verbalised that idea and been gently corrected early on, I would have saved myself years wasted assuming and spent them learning instead.
For several years now I’ve enjoyed a trajectory of increasing leadership with very little authority. As a Product Manager I lead a product – but I don’t have any formal technical qualifications. I also lead a team and a vision – but nobody reports to me. This is typical of the Product Manager role, and makes it challenging and rewarding at the same time. Strong Product Managers don’t have to bring specific technical skills to the team, but they do need soft skills, - “the ability to steer and navigate, intangible qualities and behaviors” (Cheng, 2016). Everything that allows you to understand, communicate, build consensus, debate and direct is a soft skill, and Product Managers do these things every day. It makes sense: why else would your team jump on-board for your vision? You have to be able to communicate it compellingly. Why should the business allocate resources to your plan? You need to be able to argue it persuasively. How can you be confident it will succeed? You need to listen to the people who will make it succeed – the users.
Product Management Then
Traditional definitions of the Product Manager/Product Owner (PM/PO) role have focused on the blend of skills it requires. Being a great PO includes being a customer delighter, storyteller, delegator, developer, knowledge broker, conflict resolver and escalator (Lindstrom). Others have visualised similar definitions in diagrams like this one 1:
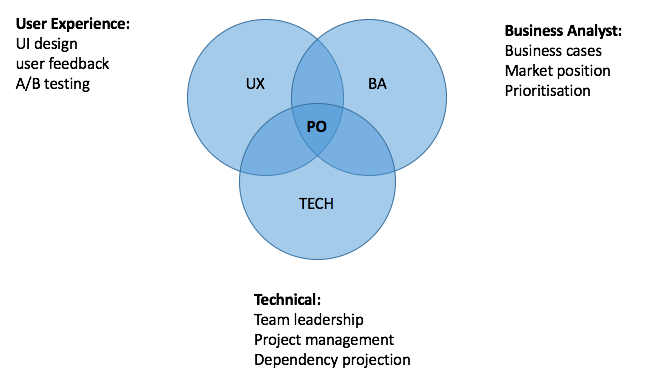
Let’s call this Product Management Then. Why? It’s meant to illustrate product’s jack-of-all-trades (master of none) nature. A PO needs some Business Analyst skills; to be able to calculate the value (e.g. revenue, user acquisition, market positioning) of potential features given the cost of development. They should also be confident in UX design, including visualising concepts and wireframing. Creating user feedback loops has also been part of the PM’s role and seems to fall within UX. Finally, a PM should be technically literate enough to lead a team of engineers, forecast dependencies, manage development projects and facilitate the process of solution-storming. All this plus a little sprinkle of something extra (management calls it ‘X-Factor’, I call it working overtime) has thus far been the recipe for a PM.
But it’s no longer adequate. Technology has moved on and so has product. This venn diagram is as helpful to an aspiring PM as a map of the USSR is to a traveller (if you see this, Mr. Eriksson, I am a big fan of yours).
So what exactly is missing here? Data is. Fundamental data science practices are the new necessity of Product Management. With data we can know what we’ve never been able to know before, and we can gather detailed feedback from users in real time, without them ever having to say a word. Better yet, data is what humans are not: unbiased. Another side to the users’ story is now audible, and we need to hear it. To meet Lindstrom’s criteria of being customer delighters, storytellers and knowledge brokers, being data-illiterate is no longer acceptable.
Do As I Do, Not As I Say
When we ask users for feedback, we get responses - and that’s the problem. Traditional feedback methodologies like surveys, focus groups and NPS questionnaires invite the user to share their opinion and to consider, edit and package their response. They decide what to share and how to share it. This feedback is at best informational, and at worst useless – especially if it’s given in a public or direct interaction (focus groups, interviews) where a myriad of social dynamics affect what is shared. For example, people will often subdue their own judgement in order to agree with the consensus of a group, even when they truly disbelieve in the group’s decision – a cognitive error called ‘social proof’ (Dobelli, 2013). This kind of response manipulation simply doesn’t happen when the participant is in a solitary, non-social setting.
Highly fertile grounds for the exploration of truth via data are found in one of the world’s largest dating sites, OkCupid. Christian Rudder, founder of OkCupid and author of Dataclysm describes how data steps in where reported feedback falls short: “unfortunately, surveys have historically been unable to uncover true attitudes on topics such as race, sexual behaviour… because respondents edit their answers” (Rudder, 2015). Dataclysm starts with a stark example of this self-editorial. According to ‘Wooderson’s law’ 2, heterosexual men who sign up to OkCupid usually specify the age range of women they’re seeking to meet as 5-10 years younger or older than themselves. So a 30-year-old man states that he’s looking to meet a woman 20-35 years old, and as his age increases, so does the range of the women he is looking for. But the data tells a different story: the female OkCupid members that the men rate as most attractive are aged 20-23, no matter the age of the man. A 20-year-old man rates 20-year-old women as most attractive, and a 50-year-old man does too. There is no deviation from this pattern among any male age group. Rudder offers a plausible explanation: “I don’t think that anyone is intentionally misleading us when they give OkCupid their preferences… I see this as a statement of what men imagine they’re supposed to desire, versus what they actually do. The gap between the two ideas just grows over the years” (Rudder, 2015). In this case, the explicit feedback is only the tip of the iceberg.
I discovered a similar example recently, while comparing user feedback to user behaviour in upday. We surveyed users to ask “what’s the main reason you use upday?”, and they overwhelmingly told us that they use it to quickly check the current headlines in the news around them. To stay informed. Not to relax with longer pieces or to explore the content recommended by their social circles, but to keep abreast of rapidly changing current events. The data seemed to support that – the vast majority of sessions came from users who visited 5-10 times a day, for less than 30 seconds each time. They scrolled the headlines and closed the app again. Case closed.
But where did the other sessions come from? Interesting, the majority of minutes spent in the app came from another kind of user – one who enjoyed long, lazy sessions, swiping through hundreds of cards, often later in the evening, 8-11pm. They didn’t seem interested in the headlines, only in consuming many different kinds of content in a relaxed way. Why were their voices not represented in the survey we launched?
By mapping the users to their sessions and plotting them out over the course of a day, it became clear that these slower users were the same people as the rapid users who voiced their feedback. During the morning and the work hours, people check the app for headlines frequently and quickly – and when questioned about it, that’s what they told us they do. However later in the evening, perhaps on the sofa distractedly watching something on Netflix, they browsed more slowly and less intensively through the app, consuming content in a less engaged way. It didn’t occur to them to tell us about this use case, because that’s not how they think of themselves using upday. But this second use case is just as important, and we never would have discovered had we not explored the data describing it. There was a chasm between users’ behaviour and the way users perceived their own behaviour. Discovering this enabled a holistic, unfiltered picture of how and why our users use upday.
Data and truth
This discrepancy between words and actions is similar to the concept of ‘Reality Mining’ coined by social physicist Alex Pentland. He describes it as “the process of analyzing the patterns within digital breadcrumbs” – or in other words, looking for meaning in data. The data we create represent reality, “by recording what each of us has chosen to do. And this is very different from what is put on Facebook; postings on Facebook are what users choose to tell each other, edited according to the standards of the day” (Pentland, 2015).
This concept can be found across domains, including in the discipline of philosophy called phenomenology, which studies how humans experience the world and their own being. It’s particularly concerned with the difference between what is objectively true and what is subjectively true, and how humans experience the objective world through their subjective senses (Owen, 1994). The philosopher Husserl named noesis as the “process of consciousness” – i.e. human experience of something, and noema as “the object as it is intended” – i.e. the actual reality of the object (Smith, 2016). This could be why our actions don’t match our words, and why we often don’t even realise it; the actual actions we take (noema) and our own perception of those actions (noesis) are just fundamentally different things, and humans aren’t great at bridging the gap. In this case it’s no surprise that our factual data doesn’t always mirror our described perception.
Blending phenomenology and reality mining might enable some new insight. Both are concerned with the difference between perception and reality, one from a theoretical point of view and one from a practical point of view. If how we perceive our actions is how we describe them in traditional feedback methodologies, then how they actually are, is reflected in the data we non-deliberately generate, and therefore mining the data for reality would give us the best insight – the other side of the user experience story. If you want to know how your users are behaving and how they interact with your platform, you have to be able to listen to not only what they say but also what they do.
Product Management Now
In the era of big data, better insights are possible. As a PM, you lead the charge of seeking, interpreting and applying user feedback in order to maximize user engagement. This in turn maximizes the business’ potential for success. Product Management Then only required you to be literate in the basic analytical skills required to pursue this goal: identifying the KPIs to improve and repeating the cycle of iterate > seek feedback > assess > adapt. Feedback methodologies like interviews, NPS (Net Promoter Score) surveys and focus groups were staples of the ‘seek feedback’ phase, resulting in insights that were anecdotal in nature, limited in scope and often scientifically invalid, due to being filtered and phrased people with situational motivations.
Product Management Now demands a greater level of data literacy, and it demands curiosity. Qualitative feedback alone is not enough, the quantitative feedback (data) that users give us must also be explored. This means that you need to be able to ask questions of the data and know how to go about answering them. I propose an extension of the diagram, to look like this:
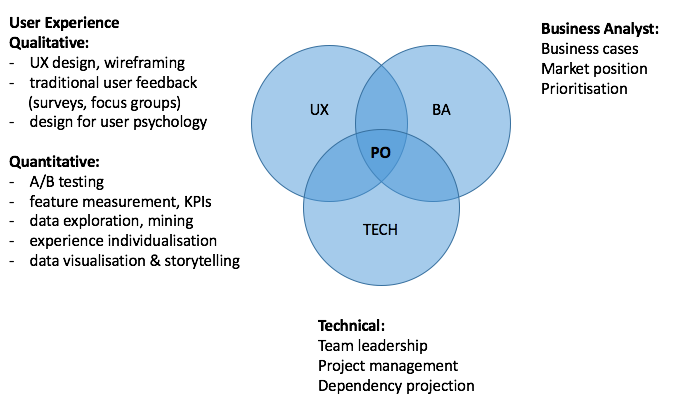
User insight encompasses everything from UI design to reality mining. Gathering user feedback now involves not only personal, traditional methods (considered feedback) but analysis of data (unconsidered feedback) too. Strong PMs today rely on measurement, testing and incremental iteration instead of gut feeling or long discussions around a table of managers who are not users. They promote cultures of curiosity and hypothesis – and then embark on the exploration needed to prove or disprove.
This doesn’t mean that a PM has to be a fully functional data scientist. Like any of the areas of expertise illustrated in Fig 1, the PM is not a replacement for domain expertise. Think competency, not fluency. But the overlap between product and data science is potentially larger than that with business or tech – because many companies do not have the resources to employ full-time data scientists (or have not culturally adapted to the necessity of doing so) the PO may represent the only data science literacy in the team. The market seems to recognize this particular compatibility: hired.com 2017 ‘State of Global Tech Salaries’ report (Kirkpatrick, 2017) noticeably splits the industry into two sections – software engineers, and product managers and data scientists. It also provides an illuminating summary of the most sought-after skill sets from both groups:
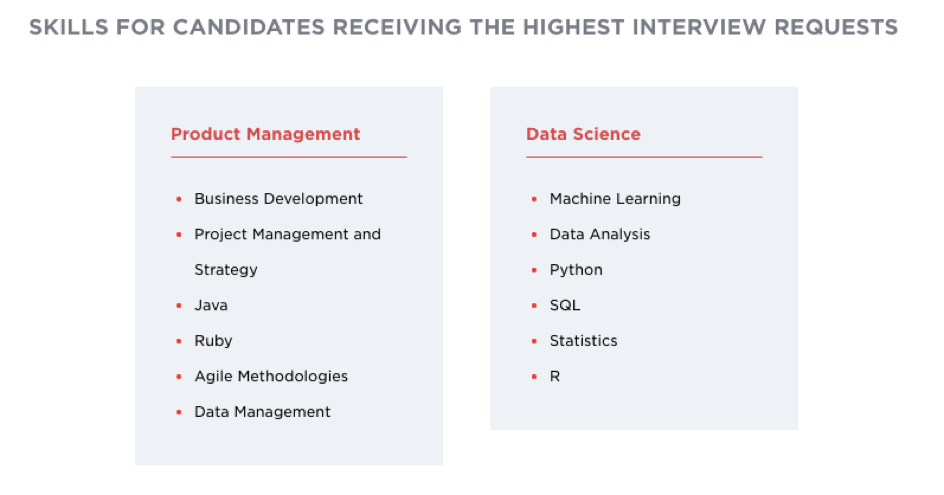
For Product Managers, data management is already a demanded skill set. This will only increase – I would not be surprised to see ‘Data Science’ skills like data analysis, SQL and statistics appearing in the ‘Product Management’ list in next year’s report. Let’s examine at a couple of typical PM responsibilities and see how traditional feedback skills augmented with real data literacy can enable better results:
Audience Development:
SQL is a database language; it allows you to interact with a database by asking questions of it and receiving results. SQL is one of the best semi-technical ways to interact with data, and as a PM the more insight you can extract without dependency on developers, the better. This was perhaps my key learning of 2016, and to act on it I undertook a data management course. Using these seedling skills, I was able to analyse upday’s users in terms of behavior, and start to classify them into ‘audiences’, essentially groups of people who share meaningful traits or interests. It’s not an understatement to say that this analysis formed the backbone of our product strategy for advertising. We were able to run campaigns targeted to the audiences I found, which resulted in engagement rates 3-4 times higher than untargeted campaigns, meanwhile reducing waste of the advertiser’s dollars and minimizing the users who saw the advertisements – a win-win.
Consensus building:
Stakeholder management is an everyday part of Product Management. PMs are the representative of the user within the company, which is full of people who have different domains of expertise, motivations and opinions. Making sure that the best features get developed requires diplomatic exercise and excellent communication (soft) skills. Often, PMs use visual aids like presentations or diagrams to share their vision more effectively. But even the most appealing diagram is worthless without the substance of proof behind it. Data scientists are experts at data visualization. This is the process of taking what you found in the data and communicating it – it’s like storytelling. DJ Patil, Data Scientist in Residence at Greylock Partners says “a data scientist is that unique blend of skills that can both unlock the insights of data and tell a fantastic story via the data” (Rogers, 2012). Murtaza Haider calls a data scientist “someone who finds solutions to problems by analyzing big or small data … and then tells stories to communicate her findings to the relevant stakeholders” (Haider, 2015). By these definitions, every PM should be part data scientist too.
The list can go on: A/B testing is more effective when you have a solid understanding of statistical relevance and how to formulate multivariate tests. Personalising user experience to encourage a particular conversion is more effective when your product can dynamically learn and adapt from user behavior. Even Agile methodologies are more effective when you can analyse and visualize the productivity data of your own team. In short, a data-literate PM is more effective than a qualitative-only PM.
It’s more important than ever for Product Managers to develop the data literacy needed to drive the process of gathering insights: after all, you are the voice of the user, there to understand and represent their needs and wants (Bharathi, 2014). Qualitative feedback alone is the tip of the iceberg, and data is emerging as the new channel of user feedback, underneath the explicit feedback we’re used to – and so too must Product Managerss emerge who are equipped to hear it all. It may have taken a couple of decades, but I figured out that the smartest people never stop checking their math.
References
Bharathi, S. (2014, July 9). Who Is Your Product Owner? Retrieved from Scrum Alliance
Cheng, G. a. (2016, 06 23). Soft Skills for a Tough World. Retrieved from Harvard Faculty of Arts & Sciences
Dobelli, R. (2013). The Art of Thinking Clearly. New York: HarperCollins.
Haider, M. (2015). What Makes Someone a Data Scientist? In M. Haider, Getting Started with Data Science (pp. 12-15). IBM Press. Retrieved from bigdatauniversity.com
Kirkpatrick, J. (2017). 2017 State of Global Tech Salaries. Retrieved from hired.com
Lindstrom, L. (n.d.). 7 Skills You Need to Be a Great Product Owner. Retrieved from Scrum Alliance
Owen, I. R. (1994). Phenomenology - What is it? And what does it do? Retrieved from The Intentionality Model
Pentland, A. (2015). Social Physics: How Social Networks Can Make Us Smarter. Boston: Penguin Books.
Rogers, S. (2012). What is a Data Scientist? Retrieved from theguardian.com
Rudder, C. (2015). Dataclysm: Love, Sex, Race, and Identity–What Our Online Lives Tell Us about Our Offline Selves. New York City: Broadway Books.
Smith, D. W. (2016). Phenomenology. Retrieved from The Stanford Encyclopedia of Philosophy (Winter 2016 Edition)